OEE in High Variant Contract Manufacturing

In contract manufacturing, product variants directly affect availability, performance, and quality.

OEE and all three of its components can be significantly influenced by the order mix. A higher OEE can mask poor production performance, while a lower OEE can conceal good production performance.

As a result, OEE values can hide poor execution or misrepresent strong production performance depending on the order mix.

Where classic OEE
fails

Classic OEE fails

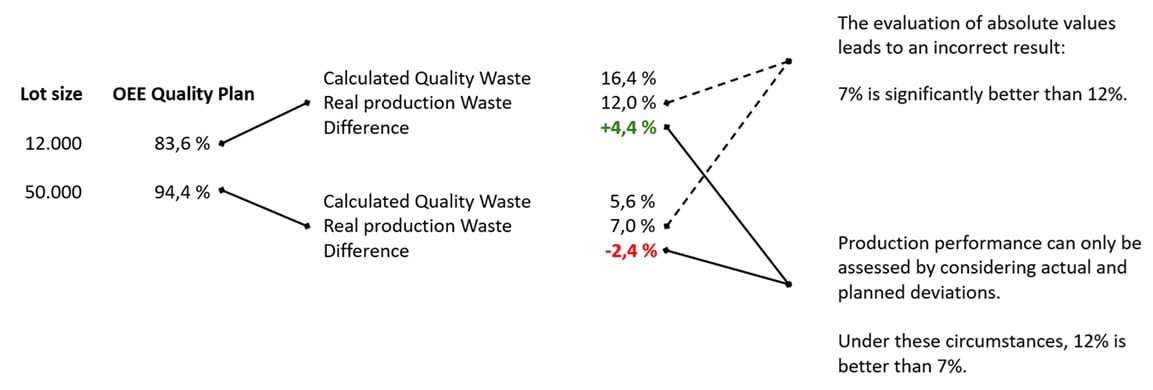
Classic OEE becomes misleading when different products require different setup times, speeds, and scrap rates. In high mix production, OEE can change simply because the order mix changes, even if production performance stays the same.

When planned losses result from commercial decisions, aggregated OEE cannot separate these effects from real production losses. As a result, OEE trends no longer reflect production performance.

Setup time is product dependent
Performance is specification dependent
Quality is mix and lot size dependent


That’s why OEE must be evaluated at production order level.

An order based OEE approach

Classic OEE fails

In environments with high product variety, OEE must be evaluated where the differences actually occur: at production order level.

Each production order has its own setup time, production speed, and expected quality. These product specific effects must be planned and evaluated separately and aligned with price calculation.

Machine level OEE is then derived by aggregating the OEEs of individual production orders, not the other way around.

Why absolute OEE values lead to wrong conclusions

Two production orders are evaluated using classic OEE quality values.

A small lot size results in an OEE Quality Plan of 83.6 percent.
A large lot size results in an OEE Quality Plan of 94.4 percent.

At first glance, the larger lot appears clearly superior.
The calculated quality waste seems much lower.

However, when comparing planned and actual waste, the picture changes.

For the small lot size
Calculated quality waste is 16.4 percent
Real production waste is 12.0 percent
Production performs 4.4 percentage points better than planned

For the large lot size
Calculated quality waste is 5.6 percent
Real production waste is 7.0 percent
Production performs 2.4 percentage points worse than planned

Evaluating absolute values alone leads to an incorrect conclusion.
Seven percent waste appears better than twelve percent waste.

Production performance can only be assessed by comparing actual results against planned expectations.

Under these circumstances, twelve percent is better than seven percent.

Mobirise Website Builder

Benefits of an order based OEE

• Fair performance assessment
Production is evaluated only on factors it can influence.
• Transparency of commercial decisions
Planned losses from product mix and pricing become visible.
• Meaningful OEE trends
OEE changes correlate again with operational performance.
• Alignment with costing and P&L
OEE and price calculation are based on the same assumptions.

Happy team in a clean factory

Key takeaways

Classic OEE fails

• Order mix and product variety can distort classic OEE.

• An order based OEE approach separates planned effects from real production losses.

• This makes OEE comparable over time and consistent with costing.